
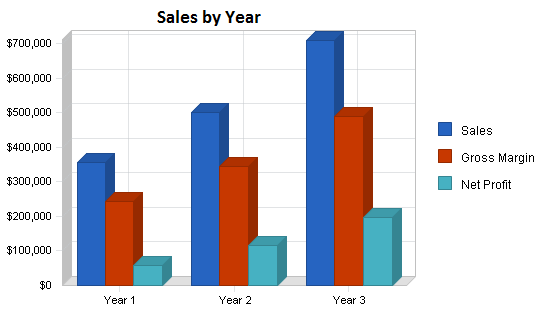
T&T Mobile is a startup company focusing on the marketing of smartphones. Our company intends to launch the smartphones business because the smartphones have revolutionized the communication landscape, and many consumers are switching from the traditional cell phones to the smartphones because of the benefits they derive from using the smartphones. Apart from assisting the consumer to make the voice and video calls, the smartphones also provide the online browsing services assisting in communicating through the chat messaging. Moreover, a number of smartphones users globally reached 1.57 billion in 2014, and the smartphone users have increased to 2.1 billion towards by the end of 2016. Moreover, the number of smartphone users globally is forecasted reaching 2.87 billion by 2020. (Statista, 2016). In the United States, 35% of American adults are using the smartphones, and in 2010, 62.6 million Americans were using the smartphones, which increased to 189 million by the end of 2015. However, the number of smartphone users are projected reaching 264.3 million by 2021. Our company will take the advantages of an increase in the number of smartphone users in the United States and globally to launch our smartphone company, and we aim to become a distinguished leader in the distribution of the smartphones. Our success factor will involve an identification of the emerging trends, integrating these trends into our business operations and responding to the technology change. We will also aim to deliver high-quality services to the customer by investing money and time in the marketing plan to expand our customer base. We will raise fund from banks to expand our operations in the United States and create the niche markets for our products. Our marketing operation will assist in creating a unique brand and we expect our sales to increase by more than 50% each year as being revealed in Fig 1:
Fig 1: Sales by Year
Our vision is to offer the customer the best and the highest quality smartphone product focusing on personalized services by delivering convenience and rapid services. We will also be using an advanced in technology to assist customer choosing their product. We will develop our staff to achieve a strong vendor’s relationship skills to meet customer demand. Our vision is also to provide the customer with excellent services, maintaining our referral network base, and respond to customer problem rapidly.
Our business, financial and marketing objectives are as follows:
Business Objectives
Financial Objectives
Marketing Objectives
Our target market will focus on consumer between 17 and 55 because these age groups are the largest percentages of people using the smartphones in the United States. However, our marketing effort will focus on the college students.
Our company will focus our marketing campaign on five categories of customers revealed as follows:
Table 1 presents our market analysis:
| Table 1: Market Analysis | ||||||||
| Potential Customer | Children 10-17 | Students | Professionals | General Public | Operating Service Companies | Other | Total | |
| Growth | 3% | 2% | 2% | 2% | 4% | 1% | 2.29% | |
| YEAR 1 | 90 | 50 | 40 | 250 | 40 | 30 | 500 | |
| YEAR 2 | 92,7 | 51 | 40,8 | 255 | 41,6 | 30,3 | 511,4 | |
| YEAR 3 | 95,481 | 52,02 | 41,616 | 260,1 | 43,264 | 30,603 | 523,084 | |
| YEAR 4 | 98,345 | 53,06 | 42,448 | 265,302 | 44,995 | 30,909 | 535,059 | |
| YEAR 5 | 101,295 | 54,121 | 43,297 | 270,608 | 46,795 | 31,218 | 547,334 | |
| CAGR | 3.00% | 2.00% | 2.00% | 2.00% | 4.00% | 1.00% | 2.29% | |
We presume to face competitions from existing and new companies in the United States and outside the United States. We presume facing competitions from companies such as Best Buy, Amazon, Walmart, Newegg T-Mobile and AT& T. Our company also presumes facing competitions with small companies. However, we will develop a unique marketing technique to enjoy market shares.
We will use both short term and long term marketing strategies to boost sales and achieve our marketing objectives. Our short-term marketing strategy will include:
Moreover, our long-term marketing technique will assist us bringing a steady flow of traffic, which will include:
By using the combination of both short-term and long-term marketing strategy, we will be able to excel our competitors. Moreover, we will create a website to launch an internet marketing to achieve a guaranteed success. We will also focus on the sales promotion for the short term marketing using the niche positioning to develop the customer and market services.
Our sales are forecasted to increase year by year. Starting from $357,000 in Year 1 and reaching $710,000 in Year 3 as revealed in Table 2 below:
| Table 2: SALES FORECAST | |||
| YEAR 1 | YEAR 2 | YEAR 3 | |
| Sales | |||
| Smart Phones | $138,000 | $190,000 | $270,000 |
| Smart Phones Accessories | $126,000 | $160,000 | $200,000 |
| Smart Wireless Phones | $46,500 | $60,000 | $90,000 |
| Other Services | $46,500 | $90,000 | $150,000 |
| TOTAL SALES | $357,000 | $500,000 | $710,000 |
| Direct Cost of Sales | Year 1 | Year 2 | Year 3 |
| Smart Phones | $31,650 | $43,560 | $61,900 |
| Smart Phones Accessories | $30,450 | $41,500 | $51,800 |
| Smart Wireless Phones | $11,700 | $15,500 | $23,300 |
| Other Services | $11,710 | $23,300 | $38,900 |
| Direct Cost of Sales (Subtotal) | $85,510 | $123,860 | $175,900 |
Our sales forecast monthly is revealed in the table below:
| SALES FORECAST | |||||||||||||
| MONTH 1 | MONTH 2 | MONTH 3 | MONTH 4 | MONTH 5 | MONTH 6 | MONTH 7 | MONTH 8 | MONTH 9 | MONTH 10 | MONTH 11 | MONTH 12 | ||
| Sales | |||||||||||||
| Smart Phones | 0% | $10,000 | $10,000 | $10,000 | $11,000 | $11,000 | $11,000 | $12,000 | $12,000 | $12,000 | $13,000 | $13,000 | $13,000 |
| Smart Phones Accessories | 0% | $9,000 | $9,000 | $9,000 | $10,000 | $10,000 | $10,000 | $11,000 | $11,000 | $11,000 | $12,000 | $12,000 | $12,000 |
| Smart Wireless Phones | 0% | $3,500 | $3,500 | $3,500 | $3,750 | $3,750 | $3,750 | $4,000 | $4,000 | $4,000 | $4,250 | $4,250 | $4,250 |
| Other Services | 0% | $3,500 | $3,500 | $3,500 | $3,750 | $3,750 | $3,750 | $4,000 | $4,000 | $4,000 | $4,250 | $4,250 | $4,250 |
| TOTAL SALES | $26,000 | $26,000 | $26,000 | $28,500 | $28,500 | $28,500 | $31,000 | $31,000 | $31,000 | $33,500 | $33,500 | $33,500 | |
| Direct Cost of Sales | Month 1 | Month 2 | Month 3 | Month 4 | Month 5 | Month 6 | Month 7 | Month 8 | Month 9 | Month 10 | Month 11 | Month 12 | |
| Smart Phones | $2,300 | $2,300 | $2,300 | $2,500 | $2,500 | $2,500 | $2,750 | $2,750 | $2,750 | $3,000 | $3,000 | $3,000 | |
| Smart Phones Accessories | $2,250 | $2,250 | $2,250 | $2,400 | $2,400 | $2,400 | $2,600 | $2,600 | $2,600 | $2,900 | $2,900 | $2,900 | |
| Smart Wireless Phones | $900 | $900 | $900 | $950 | $950 | $950 | $1,000 | $1,000 | $1,000 | $1,050 | $1,050 | $1,050 | |
| Other Services | $900 | $900 | $900 | $950 | $950 | $950 | $1,000 | $1,000 | $1,000 | $1,060 | $1,050 | $1,050 | |
| Subtotal Direct Cost of Sales | $6,350 | $6,350 | $6,350 | $6,800 | $6,800 | $6,800 | $7,350 | $7,350 | $7,350 | $8,010 | $8,000 | $8,000 | |
Success Metric
We will use the pro forma profits and loss as our success metric where our sales and net profits are projected increasing year after year. The monthly sales are revealed in the Appendix 1.
| PRO FORMA PROFIT AND LOSS | |||
| YEAR 1 | YEAR 2 | YEAR 3 | |
| Sales | $357,000 | $500,000 | $710,000 |
| Direct Cost of Sales | $85,510 | $123,860 | $175,900 |
| Other Costs of Sales | $26,824 | $30,000 | $45,000 |
| TOTAL COST OF SALES | $112,334 | $153,860 | $220,900 |
| Gross Margin | $244,666 | $346,140 | $489,100 |
| Gross Margin % | 68.53% | 69.23% | 68.89% |
| Expenses | |||
| Payroll | $123,000 | $135,960 | $148,600 |
| Marketing/Promotion | $4,500 | $10,000 | $25,000 |
| Depreciation | $0 | $0 | $0 |
| Rent | $24,000 | $24,000 | $24,000 |
| Insurance | $12,000 | $12,000 | $12,000 |
| Payroll Taxes | $0 | $0 | $0 |
| Other | $0 | $0 | $0 |
| Total Operating Expenses | $163,500 | $181,960 | $209,600 |
| Profit Before Interest and Taxes | $81,166 | $164,180 | $279,500 |
| EBITDA | $81,166 | $164,180 | $279,500 |
| Interest Expense | $0 | $0 | $0 |
| Taxes Incurred | $24,350 | $49,254 | $83,850 |
| Net Profit | $56,816 | $114,926 | $195,650 |
| Net Profit/Sales | 15.91% | 22.99% | 27.56% |
Statista (2016). A number of smartphone users worldwide from 2014 to 2020 (in billions). Statista Inc.
| Appendix 1:PRO FORMA PROFIT AND LOSS | |||||||||||||
| MONTH 1 | MONTH 2 | MONTH 3 | MONTH 4 | MONTH 5 | MONTH 6 | MONTH 7 | MONTH 8 | MONTH 9 | MONTH 10 | MONTH 11 | MONTH 12 | ||
| Sales | $26,000 | $26,000 | $26,000 | $28,500 | $28,500 | $28,500 | $31,000 | $31,000 | $31,000 | $33,500 | $33,500 | $33,500 | |
| Direct Cost of Sales | $6,350 | $6,350 | $6,350 | $6,800 | $6,800 | $6,800 | $7,350 | $7,350 | $7,350 | $8,010 | $8,000 | $8,000 | |
| Other Costs of Sales | $2,000 | $2,040 | $2,081 | $2,122 | $2,165 | $2,208 | $2,252 | $2,297 | $2,343 | $2,390 | $2,438 | $2,487 | |
| TOTAL COST OF SALES | $8,350 | $8,390 | $8,431 | $8,922 | $8,965 | $9,008 | $9,602 | $9,647 | $9,693 | $10,400 | $10,438 | $10,487 | |
| Gross Margin | $17,650 | $17,610 | $17,569 | $19,578 | $19,535 | $19,492 | $21,398 | $21,353 | $21,307 | $23,100 | $23,062 | $23,013 | |
| Gross Margin % | 67.88% | 67.73% | 67.57% | 68.69% | 68.54% | 68.39% | 69.02% | 68.88% | 68.73% | 68.95% | 68.84% | 68.70% | |
| Expenses | |||||||||||||
| Payroll | $10,250 | $10,250 | $10,250 | $10,250 | $10,250 | $10,250 | $10,250 | $10,250 | $10,250 | $10,250 | $10,250 | $10,250 | |
| Marketing/Promotion | $0 | $500 | $500 | $500 | $0 | $0 | $1,000 | $0 | $1,000 | $0 | $1,000 | $0 | |
| Depreciation | $0 | $0 | $0 | $0 | $0 | $0 | $0 | $0 | $0 | $0 | $0 | $0 | |
| Rent | $2,000 | $2,000 | $2,000 | $2,000 | $2,000 | $2,000 | $2,000 | $2,000 | $2,000 | $2,000 | $2,000 | $2,000 | |
| Insurance | $1,000 | $1,000 | $1,000 | $1,000 | $1,000 | $1,000 | $1,000 | $1,000 | $1,000 | $1,000 | $1,000 | $1,000 | |
| Payroll Taxes | 15% | $0 | $0 | $0 | $0 | $0 | $0 | $0 | $0 | $0 | $0 | $0 | $0 |
| Other | $0 | $0 | $0 | $0 | $0 | $0 | $0 | $0 | $0 | $0 | $0 | $0 | |
| Total Operating Expenses | $13,250 | $13,750 | $13,750 | $13,750 | $13,250 | $13,250 | $14,250 | $13,250 | $14,250 | $13,250 | $14,250 | $13,250 | |
| Profit Before Interest and Taxes | $4,400 | $3,860 | $3,819 | $5,828 | $6,285 | $6,242 | $7,148 | $8,103 | $7,057 | $9,850 | $8,812 | $9,763 | |
| EBITDA | $4,400 | $3,860 | $3,819 | $5,828 | $6,285 | $6,242 | $7,148 | $8,103 | $7,057 | $9,850 | $8,812 | $9,763 | |
| Interest Expense | $0 | $0 | $0 | $0 | $0 | $0 | $0 | $0 | $0 | $0 | $0 | $0 | |
| Taxes Incurred | $1,320 | $1,158 | $1,146 | $1,748 | $1,886 | $1,873 | $2,144 | $2,431 | $2,117 | $2,955 | $2,644 | $2,929 | |
| Net Profit | $3,080 | $2,702 | $2,673 | $4,079 | $4,400 | $4,369 | $5,003 | $5,672 | $4,940 | $6,895 | $6,168 | $6,834 | |
| Net Profit/Sales | 11.85% | 10.39% | 10.28% | 14.31% | 15.44% | 15.33% | 16.14% | 18.30% | 15.93% | 20.58% | 18.41% | 20.40% | |


Comments